> ## Documentation Index
> Fetch the complete documentation index at: https://help.kwentra.com/llms.txt
> Use this file to discover all available pages before exploring further.
# Revenue & Statistics Summary Report
> The Revenue & Statistics Summary Report provides a comprehensive view of the hotel’s daily, month-to-date (MTD), and year-to-date (YTD) performance against budget, with projections for the future a...
The Revenue & Statistics Summary Report provides a comprehensive view of the hotel’s daily, month-to-date (MTD), and year-to-date (YTD) performance against budget, with projections for the future as well as actual historical data.
## **Use Cases / حالات الاستخدام**
* **Owner/Management:** Tracking monthly and YTD revenue and occupancy trends versus budget/forecast.
* **Finance:** Reconciliation between actuals and PMS/GL.
* **Operations:** Monitoring daily performance and identifying anomalies in guest movement or revenue.
***
## **Report Structure & Groupings**
### **Main Sections**
* **Room & Guest Statistics**
* **Total Hotel Revenue**
* **Departmental Revenue Breakdown**
* **Meals Description**
* **Category Rooms Occupied**
* **Future Projections**
***
## **Column Headers**
* **Statistic:** The KPI or line item (e.g., Rooms To Sell, Out Of Order).
* **Day:** Actual value for the report date.
* **Day (Bdgt):** Budgeted value for the report date.
* **Var:** Day - Day (Bdgt).
* **MTD:** Month-to-date actual value.
* **MTD (Bdgt):** MTD budget value.
* **Var:** MTD - MTD (Bdgt).
* **YTD:** Year-to-date actual value.
* **YTD (Bdgt):** YTD budget value.
* **Var:** YTD - YTD (Bdgt).
***
## **Row-by-Row Explanation**
**\[All KPIs listed below are bilingual. Example rows from your report are provided.]**
### **Room & Guest Statistics**
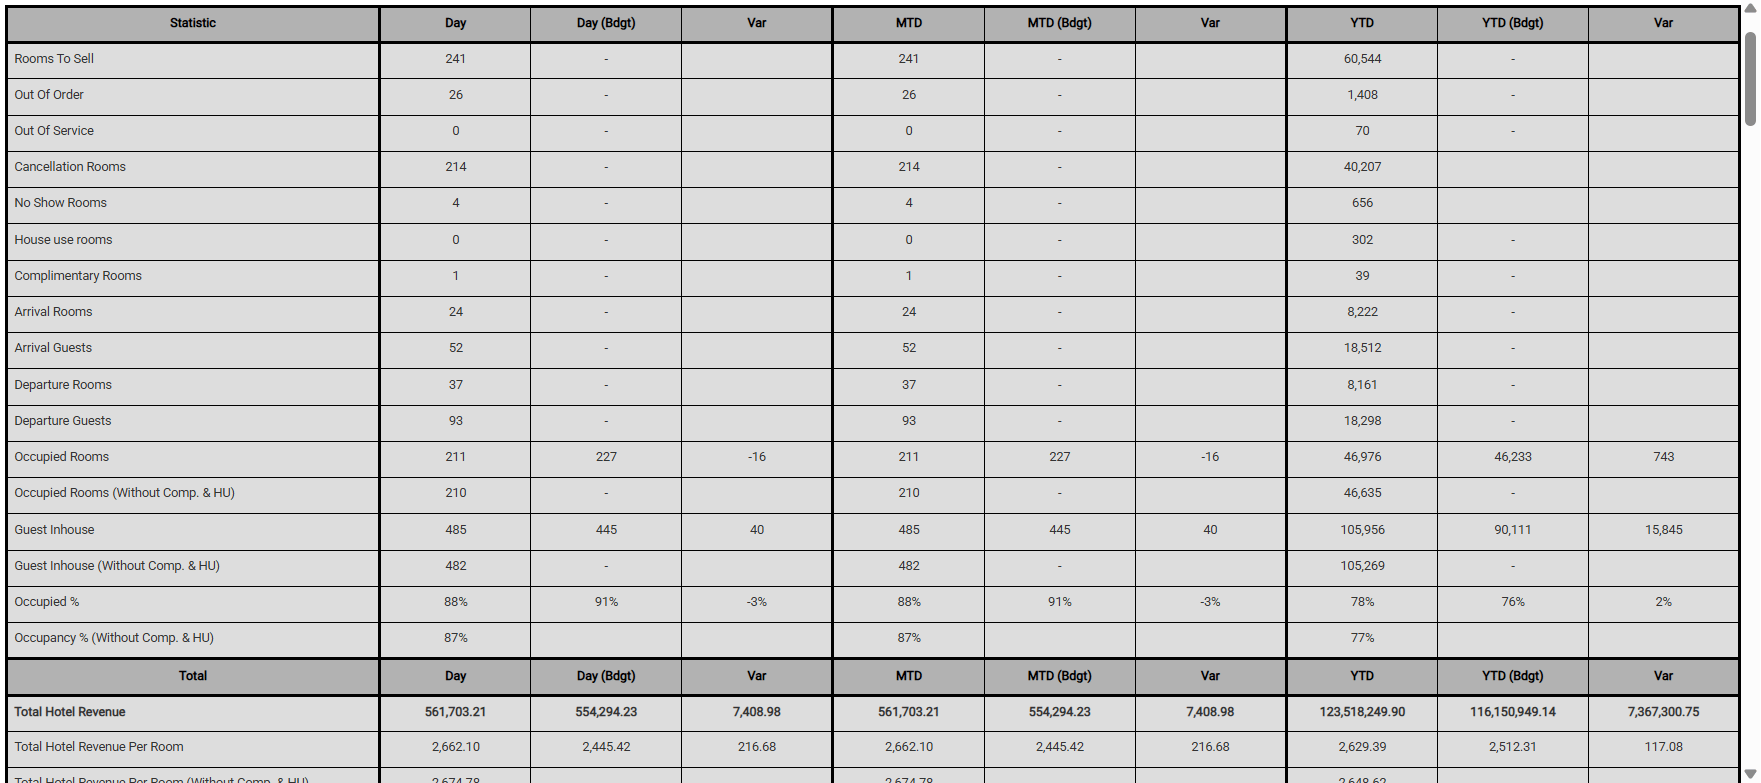
* **Rooms To Sell:** Total rooms available for sale (e.g., 241).
* **Out Of Order:** Rooms not available due to maintenance/etc. (e.g., 26).
* **Out Of Service:** Temporarily closed rooms (e.g., 0).
* **Cancellation Rooms:** Canceled reservations (e.g., 214).
* **No Show Rooms:** Booked but not occupied (e.g., 4).
* **House use rooms:** Rooms used by staff/house use (e.g., 0).
* **Complimentary Rooms:** Comped rooms (e.g., 1).
* **Arrival Rooms/Guests:** Number of arriving rooms/guests.
* **Departure Rooms/Guests:** Number of departing rooms/guests.
* **Occupied Rooms:** Total occupied rooms.
* **Occupied Rooms (Without Comp. & HU):** Occupied rooms excluding comp and house use.
* **Guest Inhouse:** Number of guests staying.
* **Guest Inhouse (Without Comp. & HU):** As above, excluding comp/HU.
* **Occupied %:** = Occupied Rooms / Rooms To Sell.
* **Occupancy % (Without Comp. & HU):** Excludes comp/HU.
***
### **Revenue Metrics & Departmental Breakdown**
#### **Total Hotel Revenue**
* **Total Hotel Revenue:** All revenue sources (e.g., 553,823.21 on 1-Sep-2025).
* **Total Hotel Revenue Per Room:** = Total Revenue / Occupied Rooms.
* **Total Hotel Revenue Per Room (Without Comp. & HU):** Same formula, exclude comp/HU.
* **Total Hotel Revenue Per Available Rooms:** = Total Revenue / Rooms To Sell.
* **Total Hotel Revenue per Guest Inhouse:** = Total Revenue / Guest Inhouse.
#### **Food & Beverage (F\&B)**
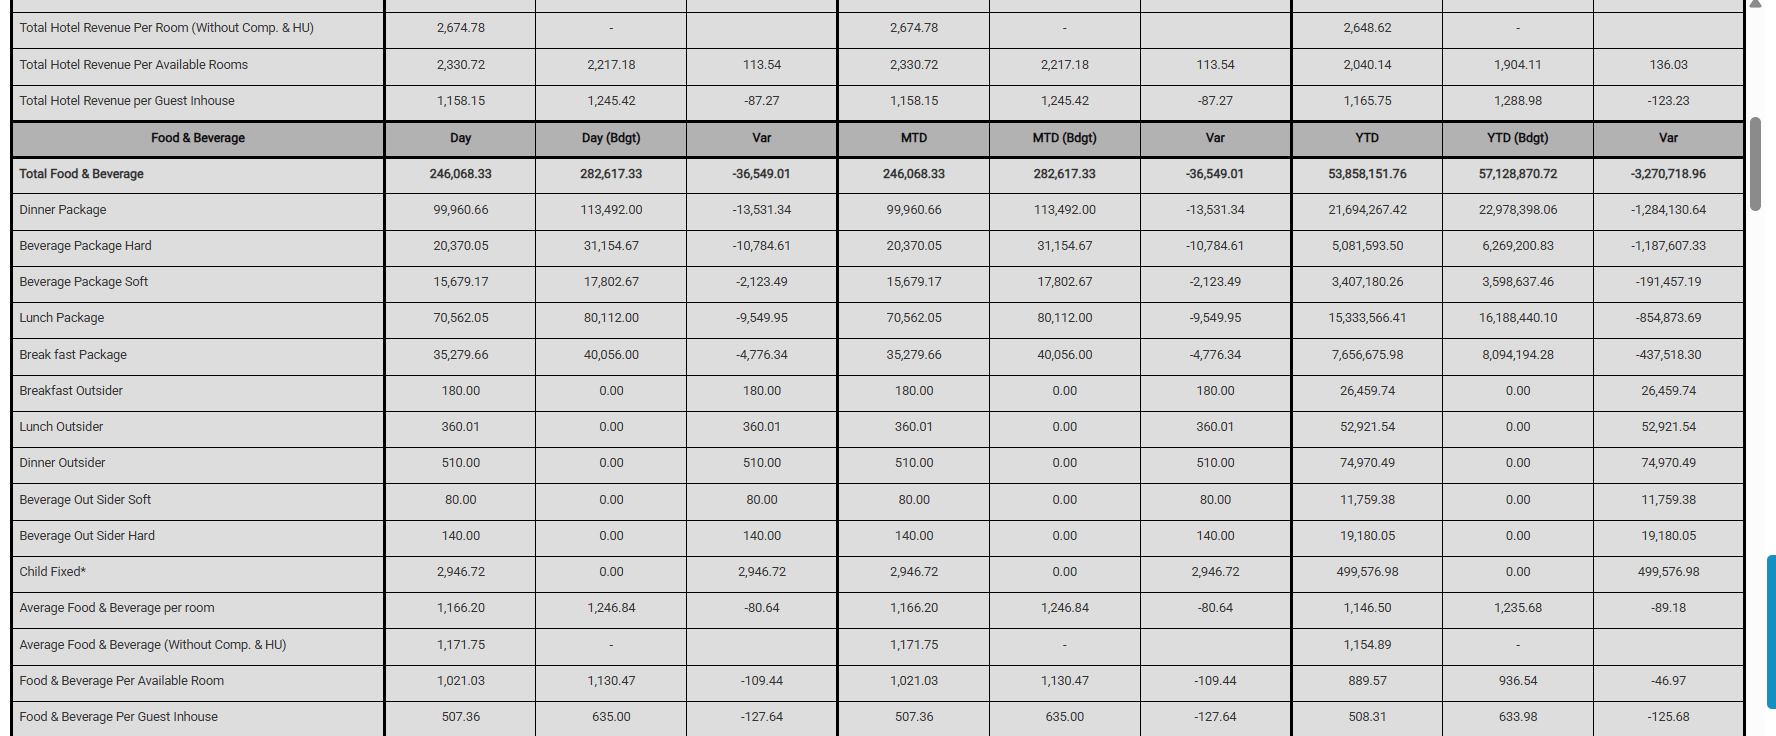
* **Total Food & Beverage:** Sum of F\&B-related postings.
* **Dinner Package, Lunch Package, Beverage Package (Hard/Soft), etc.:** Revenue from relevant meal packages.
* **Breakfast/Lunch/Dinner Outsider:** Revenue from non-resident guests.
* **Child Fixed:** Revenue for children meals.
* **Averages:**
* *Average F\&B per room* = F\&B Revenue / Occupied Rooms
* *Per Available Room* = F\&B Revenue / Rooms To Sell
* *Per Guest Inhouse* = F\&B Revenue / Guest Inhouse
**No Statistics Type**
* **Revenue Departments** with no statistic type set up.
**Meals Description**
* **Covers/Revenue:** Breakdown of meal covers sold and related revenue, by meal type and guest category.
#### **Category Rooms Occupied**
* **Day/MTD/YTD:** Number of rooms occupied per room category (e.g., Standard Garden View).
#### **Future Projections**
* **Values in “Day” columns are projections based on current bookings, not actuals.**
***
## **Key Formulas**
* **Occupied %:**
* `= (Occupied Rooms / Rooms To Sell) * 100`
* **Total Hotel Revenue Per Room:**
* `= Total Hotel Revenue / Occupied Rooms`
* **Total Hotel Revenue Per Guest Inhouse:**
* `= Total Hotel Revenue / Guest Inhouse`
* **Departmental Averages (e.g., F\&B per room):**
* `= Department Revenue / Occupied Rooms`
* **Var (Variance):**
* `= Actual - Budgeted` for each column.
* **Per Available Room:**
* `= Department Revenue / Rooms To Sell`
* **Averages “(Without Comp. & HU)”** exclude comp/house use rooms from the denominator.
***
## **Example Data**
### Real Example: 1st September 2025
* **Rooms To Sell:** 241
* **Out Of Order:** 26
* **Occupied Rooms:** 211
* **Occupied %:** 88%
* **Total Hotel Revenue:** 553,823.21
* **Total F\&B:** 246,068.33
* **Total Logis:** 305,476.14
* **Total Laundry:** 0.00
***
## **What Affects the Numbers?**
* **Past Periods:**
* Reservation/room status in PMS
* Actual posted transactions (room revenue, F\&B, misc.)
* Folio postings and corrections