> ## Documentation Index
> Fetch the complete documentation index at: https://help.kwentra.com/llms.txt
> Use this file to discover all available pages before exploring further.
# Market Segment DMY Report
> Track your business performance by analyzing revenue, occupancy, and segmentation across channels, sources, and markets. Business Value Provides comprehensive visibility into revenue and occupancy...
Track your business performance by analyzing revenue, occupancy, and segmentation across channels, sources, and markets.
***
### **Business Value**
* Provides comprehensive visibility into revenue and occupancy by market segment, channel, or source.
* Enables data-driven pricing and marketing decisions.
* Helps identify high-value and underperforming segments.
* Supports benchmarking and business planning by day, month, or year.
* Increases accountability and transparency for all revenue streams.
***
### **Use Cases**
* Analyze daily, monthly, or yearly performance by segment (e.g., Online, Travel Agency, Corporate).
* Monitor the impact of marketing campaigns on specific channels or markets.
* Identify booking trends and seasonality for each segment.
* Compare occupancy rates (OCC%) and Average Daily Rate (ADR) across different sources.
* Generate targeted sales or revenue reports for internal meetings or external partners.
***
### **Technical Know-How**
**1. Accessing the Report**
* **Navigation:**
`Reports → FO → Reservation → Market segment dmy`
**2. Report Filters & Options**
* **Date:** Select the reporting date (the report will display Day, Month, and Year aggregation for that date).
* **Level of Details:** Choose between “Channels”, “Sources”, or “Markets” for segmentation.
* **Reservation Confirmation:** Filter by “Confirmed Only”, “Tentative Only”, or “All” reservations.
* **File Type:** Export to XLS, XLSX, ODS, or PDF.
* **Download, Preview, Print:** Use buttons to export or preview the report.
**3. Report Layout & Fields**
Each row represents a segment (channel, source, or market) with the following columns for **Day**, **Month**, and **Year**:
* Rooms – Number of rooms sold
* Room Rev – Room revenue
* **Room Revenue:** Room revenue (posted to the rooms department) attributed to this channel only.
* *For revenue departments to appear as columns, need to be added and linked to revenue codes.*
* ADR – Average Daily Rate
* OCC% – Occupancy percentage
* Adults / Children – Number of adults and children
* Selling Rate – Selling rate per segment
**4. Examples & Best Practices**
* Use “Channels” to see revenue split between OTA, Direct, Corporate, etc.
* Use “Sources” to understand which agencies or corporate accounts drive bookings.
* Use “Markets” to analyze regional demand.
***
### **FAQs**
* **Q: What’s the difference between ADR and Selling Rate?**
A: ADR is the average rate per occupied room, while Selling Rate may include package or segment-specific pricing.
## ***Update: 23 Apr, 2026***
### **Grand Total Row**
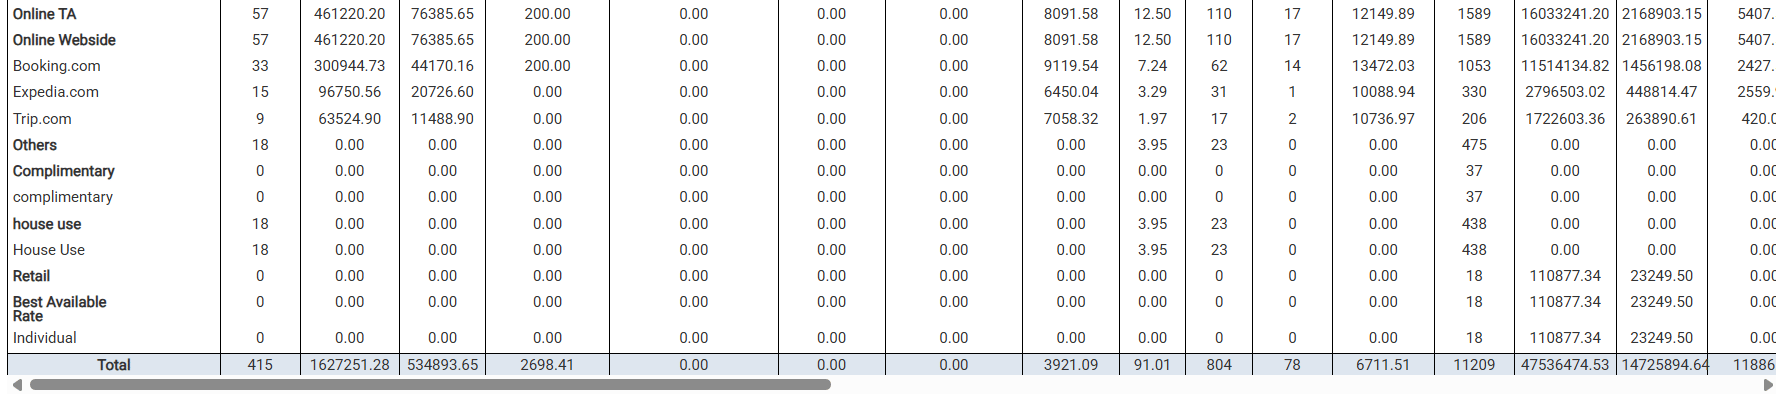
The Market Segment DMY Report now shows a Total row at the end of each Day, Month, and Year section, summarising all channel figures in one line.
 **How It Works**
**Total Row Behaviour**
The report is split into three sections: Day, Month, and Year. Each section now ends with a Total row that aggregates all the channel rows above it.
**Total Row Calculations**
Each column in the Total row is calculated as follows:
| **Column** | **How the Total Is Calculated** | **Format** |
| ---------------------- | ----------------------------------------- | -------------------------- |
| Rooms | Sum of all channel rows | Whole number (no decimals) |
| Statistic Type Columns | Sum of all channel rows | Decimal |
| ADR | Total Room Revenue ÷ Total Occupied Rooms | Decimal |
| Occ% | Total Occupied Rooms ÷ Total Rooms | Decimal |
| Adults | Sum of all channel rows | Whole number (no decimals) |
| Children | Sum of all channel rows | Whole number (no decimals) |
| Selling Rate | Total Revenue ÷ Total Occupied Rooms | Decimal |
**Notes**
* The Total row appears at the bottom of the Day section, the Month section, and the Year section independently.
* Rooms, Adults, and Children values are always displayed as whole numbers (integers) — no decimal places.
* ADR and Selling Rate are derived figures — they are not summed; they are recalculated from the totals.
## ***Update: 6 May, 2026***
### **Multi-Currency Support**
The Market Segment DMY Report now supports multi-currency — view daily, monthly, and yearly revenue breakdowns in any configured currency.
**How It Works**
**Running the Report**
| **Where:** Reports → Front Office → Reservation → Market Segment DMY |
| -------------------------------------------------------------------- |
**How It Works**
**Total Row Behaviour**
The report is split into three sections: Day, Month, and Year. Each section now ends with a Total row that aggregates all the channel rows above it.
**Total Row Calculations**
Each column in the Total row is calculated as follows:
| **Column** | **How the Total Is Calculated** | **Format** |
| ---------------------- | ----------------------------------------- | -------------------------- |
| Rooms | Sum of all channel rows | Whole number (no decimals) |
| Statistic Type Columns | Sum of all channel rows | Decimal |
| ADR | Total Room Revenue ÷ Total Occupied Rooms | Decimal |
| Occ% | Total Occupied Rooms ÷ Total Rooms | Decimal |
| Adults | Sum of all channel rows | Whole number (no decimals) |
| Children | Sum of all channel rows | Whole number (no decimals) |
| Selling Rate | Total Revenue ÷ Total Occupied Rooms | Decimal |
**Notes**
* The Total row appears at the bottom of the Day section, the Month section, and the Year section independently.
* Rooms, Adults, and Children values are always displayed as whole numbers (integers) — no decimal places.
* ADR and Selling Rate are derived figures — they are not summed; they are recalculated from the totals.
## ***Update: 6 May, 2026***
### **Multi-Currency Support**
The Market Segment DMY Report now supports multi-currency — view daily, monthly, and yearly revenue breakdowns in any configured currency.
**How It Works**
**Running the Report**
| **Where:** Reports → Front Office → Reservation → Market Segment DMY |
| -------------------------------------------------------------------- |
 | Currency selected will be based on the current exchange rate at the time of report generation. |
| ---------------------------------------------------------------------------------------------- |
**Converted Fields**
When a currency other than the base is selected, the following fields are automatically converted across Day, Month, and Year breakdowns:
* Gross Rate Amount
* Net Rate Amount (Room Revenue)
* Statistic type revenue departments
* ADR (Average Daily Rate)
* ASR (Average Selling Rate)
The Grand Total row and all Day / Month / Year breakdowns reflect the converted values.
| Currency selected will be based on the current exchange rate at the time of report generation. |
| ---------------------------------------------------------------------------------------------- |
**Converted Fields**
When a currency other than the base is selected, the following fields are automatically converted across Day, Month, and Year breakdowns:
* Gross Rate Amount
* Net Rate Amount (Room Revenue)
* Statistic type revenue departments
* ADR (Average Daily Rate)
* ASR (Average Selling Rate)
The Grand Total row and all Day / Month / Year breakdowns reflect the converted values.