> ## Documentation Index
> Fetch the complete documentation index at: https://help.kwentra.com/llms.txt
> Use this file to discover all available pages before exploring further.
# Insights App — Selling Rate KPI in Performance Report
> The Performance Report now includes Selling Rate alongside OCC%, TREVPAR, and Total Rev for a complete revenue picture. Business Value See Selling Rate per property for Day, MTD, and YTD at a glanc...
The Performance Report now includes Selling Rate alongside OCC%, TREVPAR, and Total Rev for a complete revenue picture.
**Business Value**
* See Selling Rate per property for Day, MTD, and YTD at a glance.
* Compare current year vs. previous year Selling Rate directly in the report.
* Total row aggregates Selling Rate across all accessible properties automatically.
* No manual calculation — Selling Rate is computed from actual room nights.
* Make faster rate decisions with a complete set of revenue KPIs.
**Use Cases**
* Revenue manager opens the Performance Report and sees Selling Rate alongside OCC%, TREVPAR, and Total Rev for each property.
* GM compares this month's Selling Rate (CY vs PY) to measure rate performance against the same period last year.
* Multi-property owner reviews the Total row to see aggregated Selling Rate across all properties in one view.
**How It Works**
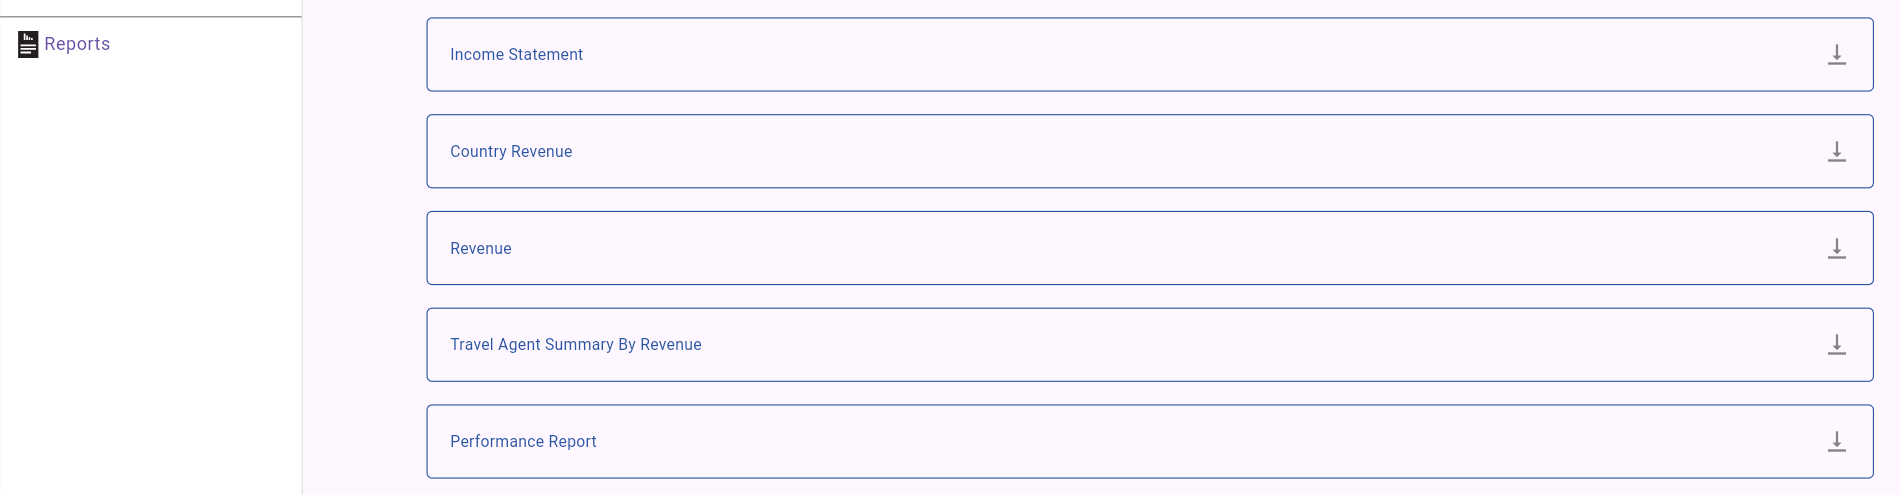
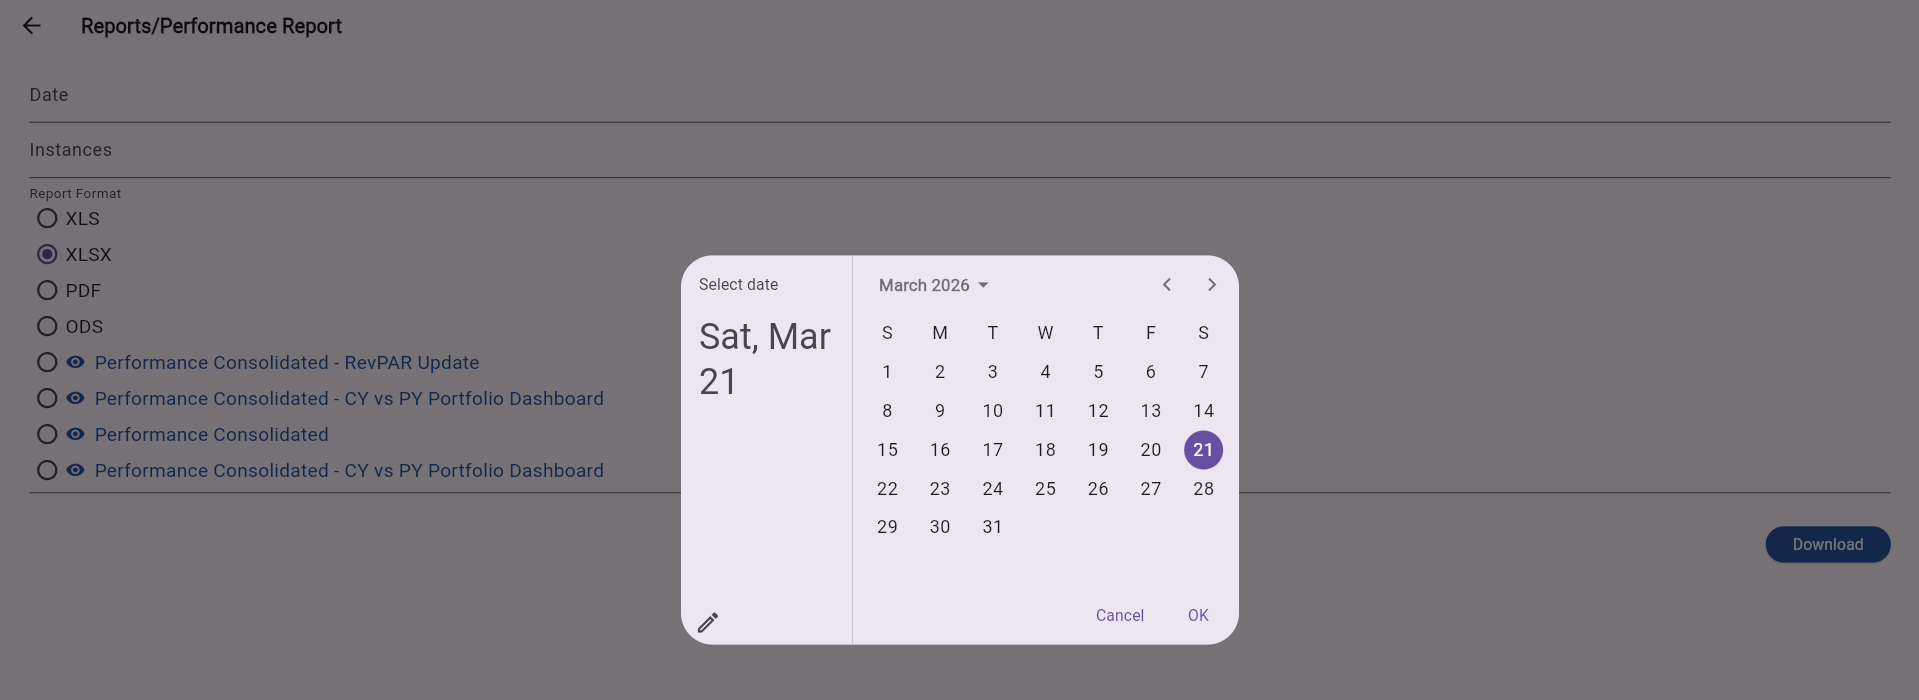
| **Where:** Insights App → Reports → Performance Report Dashboard → Reports → Performance Report |
| ------------------------------------------------------------------------------------------------ |
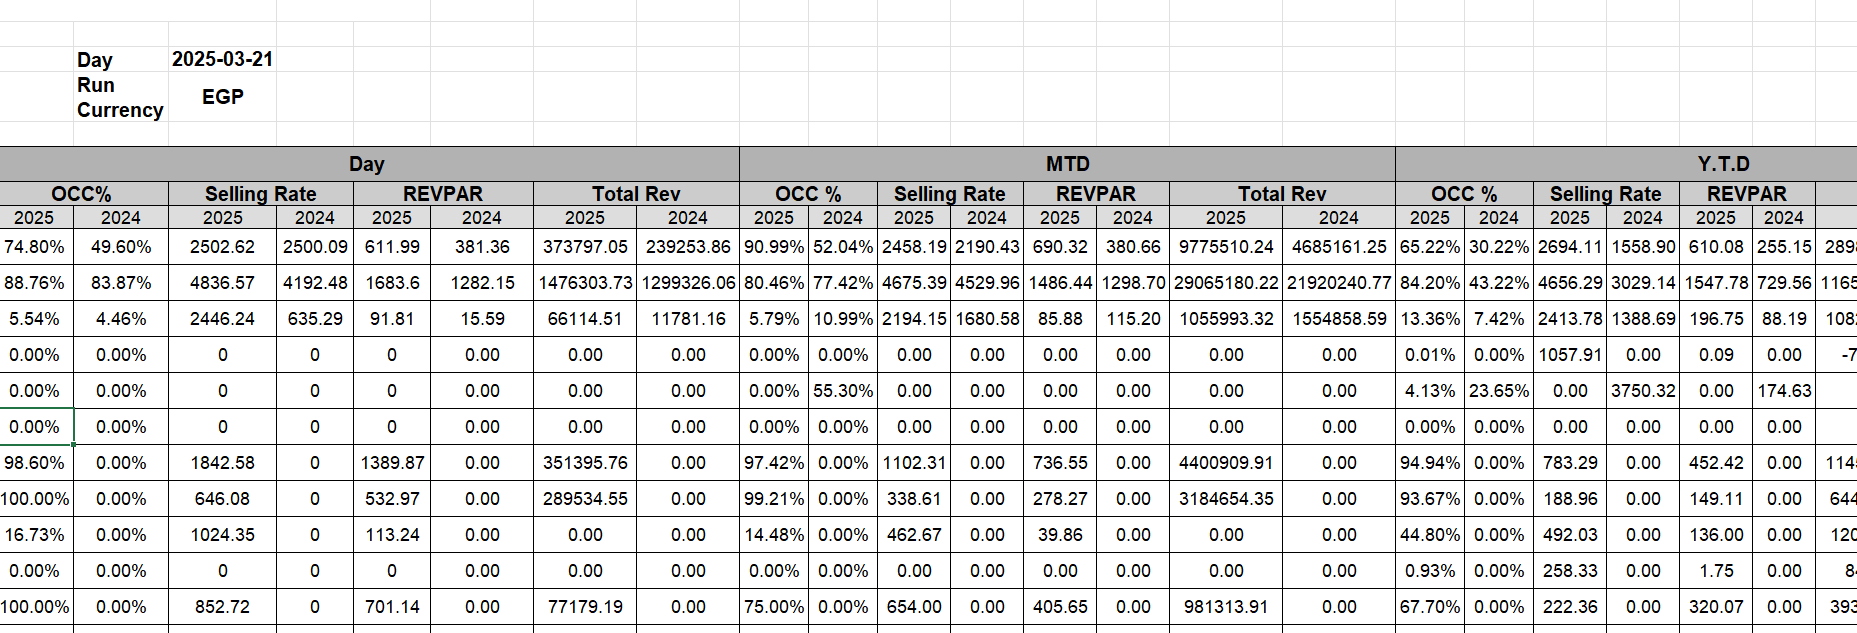
 The Performance Report now displays four KPIs: OCC%, TREVPAR, Total Rev, and Selling Rate. The report is organized into three time periods:
* Day — today vs. the same day last year.
* MTD (Month to Date) — current month vs. the same month last year.
* YTD (Year to Date) — current year vs. the same year last year.
Each KPI shows CY (Current Year) and PY (Previous Year) values per property, with a Total row at the bottom that aggregates across all properties the user has access to.
**How Selling Rate Is Calculated**
| **Selling Rate Formula:** Selling Rate = Total Gross Rate Amount (packages + room rate) ÷ Occupied Room Nights • Includes reservations in Expected, Checked In, or Checked Out status only. • The Total row aggregates Selling Rate across all properties the logged-in user can access. |
| ------------------------------------------------------------------------------------------------------------------------------------------------------------------------------------------------------------------------------------------------------------------------------------------- |
The Performance Report now displays four KPIs: OCC%, TREVPAR, Total Rev, and Selling Rate. The report is organized into three time periods:
* Day — today vs. the same day last year.
* MTD (Month to Date) — current month vs. the same month last year.
* YTD (Year to Date) — current year vs. the same year last year.
Each KPI shows CY (Current Year) and PY (Previous Year) values per property, with a Total row at the bottom that aggregates across all properties the user has access to.
**How Selling Rate Is Calculated**
| **Selling Rate Formula:** Selling Rate = Total Gross Rate Amount (packages + room rate) ÷ Occupied Room Nights • Includes reservations in Expected, Checked In, or Checked Out status only. • The Total row aggregates Selling Rate across all properties the logged-in user can access. |
| ------------------------------------------------------------------------------------------------------------------------------------------------------------------------------------------------------------------------------------------------------------------------------------------- |
 **Report Example**