The Occupancy screen now includes a Forecast tab, showing projected occupancy by month across a selectable range — alongside the existing Actual tab. Business ValueDocumentation Index
Fetch the complete documentation index at: https://help.kwentra.com/llms.txt
Use this file to discover all available pages before exploring further.
- View occupancy forecasts up to 12 months ahead — plan capacity before arrivals happen.
- Compare past actuals, current-month mixed data, and future forecasts in one screen.
- Adjust the month range anytime to focus on the planning window that matters.
- Multi-property view — one column per hotel per month, with a totals row.
- Available on web and mobile — accessible anywhere.
- Revenue manager selects the next 6 months to spot low-occupancy periods and plan promotions early.
- GM reviews the current month’s mixed forecast to gauge how close the hotel is to full occupancy.
- Multi-property owner compares forecasted occupancy across all hotels for the upcoming quarter.
| Where: Kwentra Insights App → Occupancy → Forecast |
|---|
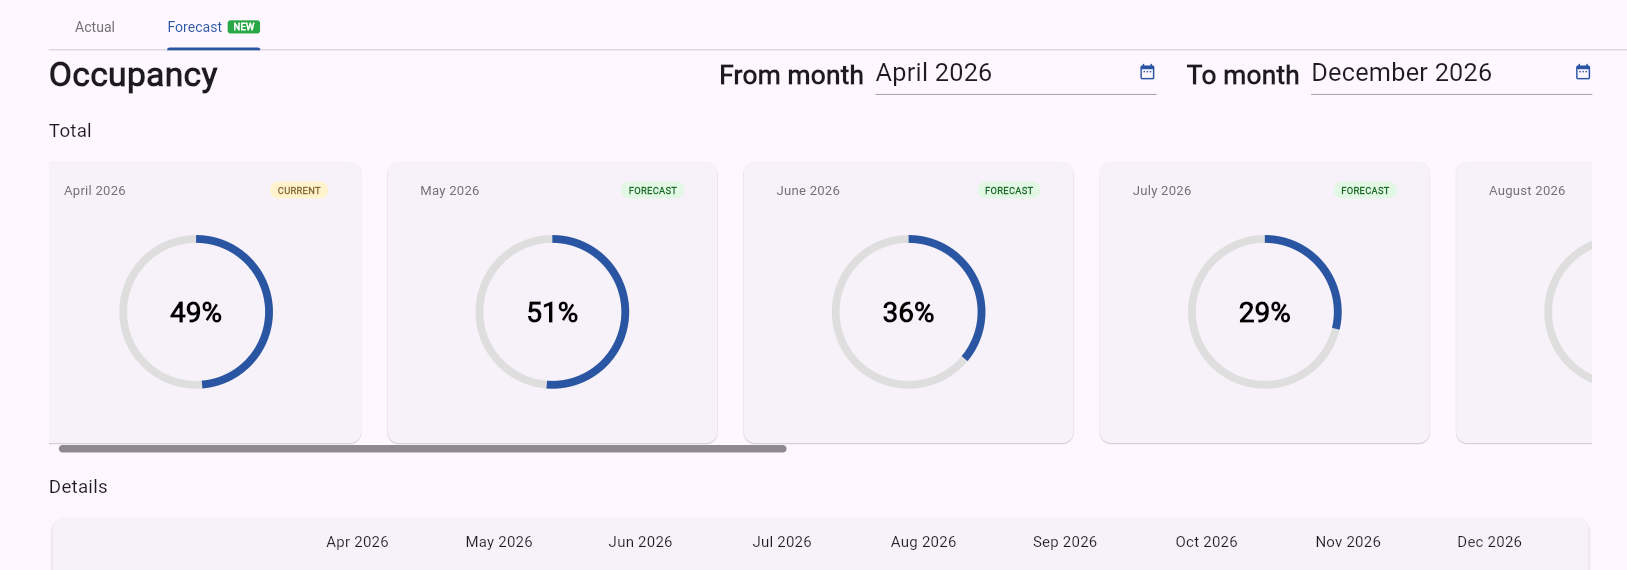 Month Range Selector
Two month pickers: From month and To month. Defaults to current month → current month + 2. Maximum range: 12 months.
Validation: From month must be ≤ To month; range cannot exceed 12 months.
Total Section
One month card per month in the selected range. Each card includes a donut visual matching the Actual tab style.
Details Section
One column per hotel per month in the selected range. A totals row appears at the bottom.
Scroll Behaviour
Horizontal scroll activates automatically when cards or columns exceed the viewport.
Data Behaviour
Data is sourced from the accommodation breakdown.
Month Range Selector
Two month pickers: From month and To month. Defaults to current month → current month + 2. Maximum range: 12 months.
Validation: From month must be ≤ To month; range cannot exceed 12 months.
Total Section
One month card per month in the selected range. Each card includes a donut visual matching the Actual tab style.
Details Section
One column per hotel per month in the selected range. A totals row appears at the bottom.
Scroll Behaviour
Horizontal scroll activates automatically when cards or columns exceed the viewport.
Data Behaviour
Data is sourced from the accommodation breakdown.
| Month Type | Data Shown | Example |
|---|---|---|
| Past months | Actual values | Jan 2025 — 78% |
| Current month | Mixed — actuals so far + forecast for rest | Apr 2026 — 65% actual + 70% forecast |
| Future months | Forecast values | Jul 2026 — 82% |