Track all revenue generated across Front Office and POS departments — with Actual vs. Budget comparisons for Today, Month-to-Date, Year-to-Date, and Last Year, in a single report. Business ValueDocumentation Index
Fetch the complete documentation index at: https://help.kwentra.com/llms.txt
Use this file to discover all available pages before exploring further.
- View total revenue across all FO and POS departments grouped by department group.
- Compare Actual vs. Budget for Today, Month-to-Date, and Year-to-Date in one view.
- Benchmark this year’s performance against the same period last year.
- Filter by department to focus on specific revenue streams.
- Export as XLS, XLSX, ODS, or PDF for finance and operations teams.
- Night Auditor runs the report after posting to verify all revenue departments balanced correctly for the day.
- Finance Manager reviews Month-to-Date actual vs. budget at mid-month to flag departments falling behind.
- Revenue Manager exports the Year-to-Date view to compare this year’s Room Revenue against last year.
| Parameter | Description | Example |
|---|---|---|
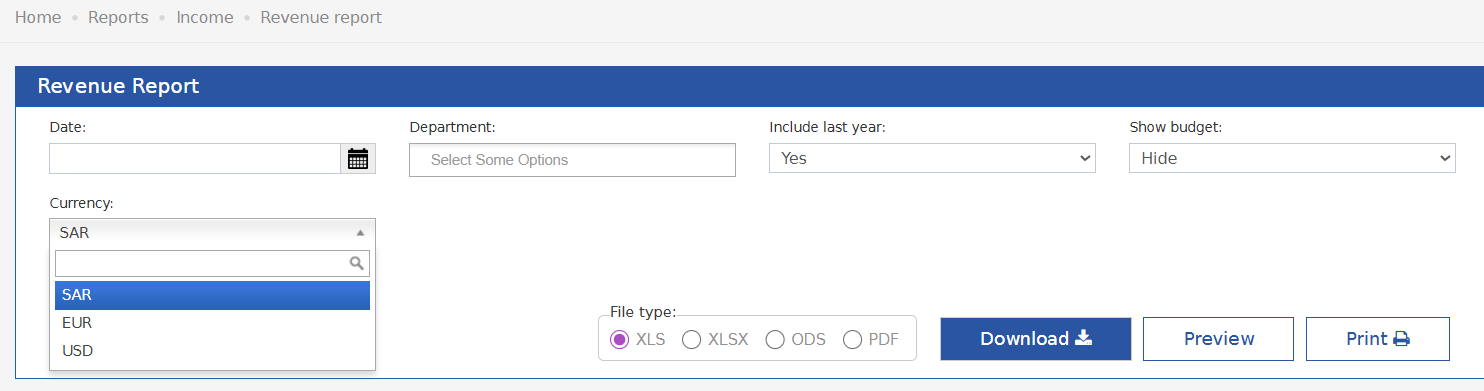
| Date | Posting Audit Date — the date you want to view revenue for. | 2025-09-18 |
| Department | Optional — filter the report to show specific department(s) only. | Room Revenue, F&B |
| Include Last Year | Yes / No — show or hide the Last Year comparison columns. | Yes |
| Show Budget | Show / Hide — display or collapse the Budget columns in each section. | Show |
| File Type | Choose the export format. | XLS, XLSX, ODS, PDF |
- Today — Actual and Budget for the selected Posting Audit Date.
- Month T.D — cumulative Actual and Budget from the 1st of the month to the selected date.
- Year T.D — cumulative Actual and Budget from 1 January to the selected date.
- Last Year — Day, Month, and Year comparisons (Actual and Budget) from the previous year.
| Column | Description | Example |
|---|---|---|
| Dept. Code | Unique code identifying the revenue department or group. | RO, FB, LAU |
| Department | Name of the department or department group row. | Room Revenue |
| Today — Actual | Total actual revenue posted for the selected Posting Audit Date. | 2,903.21 |
| Today — Budget | Budget target for the selected date (daily budget). | 0.00 |
| Month T.D — Actual | Cumulative actual revenue from the 1st of the month to the selected date. | 45,985.52 |
| Month T.D — Budget | Cumulative month-to-date budget target. | 0.00 |
| Year T.D — Actual | Cumulative actual revenue from 1 January to the selected date. | 84,295.77 |
| Year T.D — Budget | Cumulative year-to-date budget target. | 0.00 |
| Last Year — Day | Actual revenue for the same day in the previous year. | 0.00 |
| Last Year — Day (Budget) | Budget for the same day in the previous year. | 0.00 |
| Last Year — Month | Month-to-date actual for the same period in the previous year. | 0.00 |
| Last Year — Month (Budget) | Month-to-date budget for the same period in the previous year. | 0.00 |
| Last Year — Year | Full-year actual for the previous year (Jan 1 – Dec 31). | 987,111.79 |
| Last Year — Year (Budget) | Full-year budget for the previous year. | 0.00 |
| Total [Group] | Subtotal row for each department group (bold). | Total Room Revenue: 32,083.08 |
| Grand Total | Sum of all department groups across all columns. | 32,083.08 |
Update: 19 Feb 2026
The Revenue Report now reflects Hijri daily budgets — showing accurate Today, Month T.D, and Year T.D budget figures per department. Hijri Daily Budget — Budget Column Behaviour When a Hijri daily budget is imported for a month, the Budget columns (Today, Month T.D, Year T.D) update their calculation as follows: When only a monthly budget is imported:- Today (Budget) = monthly budget ÷ number of days in the month
- Month T.D (Budget) = total imported monthly budget
- Year T.D (Budget) = sum of all months + days from 1 January to the selected date
- Today (Budget) = the imported budget for that specific day
- Month T.D (Budget) = sum of all imported daily budgets for that month
- Year T.D (Budget) = cumulative sum from 1 January, using Hijri daily budgets where available
Update: 27 Apr, 2026
Multi Currency Support
The Revenue Report now supports multi-currency output, converting all department amounts to any configured currency at the current exchange rate. Business Value- View revenue totals in any currency configured on the system — not just base currency.
- Speeds up reporting for multi-currency properties and international ownership groups.
- Includes Exchange Factor in the report output for full transparency on conversion rates used.
- Applies in both the standard Revenue Report and the Insights App Revenue Report.
- Single-select dropdown listing all currencies configured on the system.
- Defaults to the property’s base currency — no change to existing behavior unless a different currency is selected.
- Help text displayed below the field: “Currency selected will be based on current exchange rate at time of report generation.”
 Effect on Report Output
When a currency other than the base is selected:
Effect on Report Output
When a currency other than the base is selected:
- All department amounts — Today, Month T.D, Year T.D, Last Year — are converted to the selected currency.
- Conversion uses the current exchange rate at the time the report is generated.
- The report header now includes two additional parameter lines: Currency (selected currency name) and Exchange Factor (rate applied at generation time).