Documentation Index
Fetch the complete documentation index at: https://help.kwentra.com/llms.txt
Use this file to discover all available pages before exploring further.
Report Business Value:
- Analyze daily and future occupancy trends across all sales channels
- Quickly identify performance gaps in room revenue, occupancy, and guest mix
- Simplify forecasting by comparing actual historical results to future projections
- Troubleshoot variances by channel, date, or booking source
How does it work?
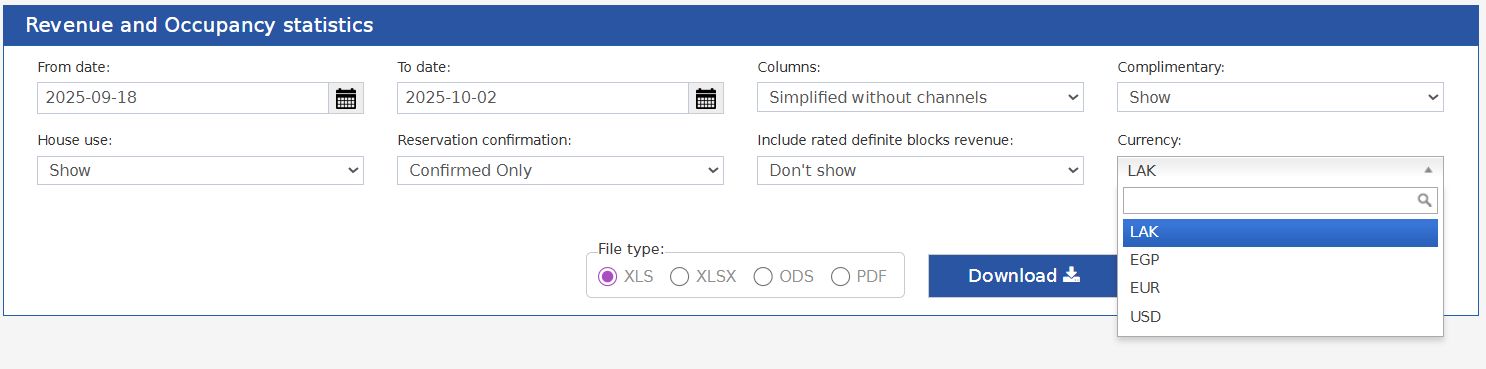
Reports → FO → Reservation → Revenue and Occupancy Statistics- Select the date range you would like to view this report in.
- Columns: if selected detailed it will return the number of adults and children, room revenue, ADR and the total number of rooms coming from each channel on these selected dates.
- Columns: if selected simplified it will return the total number of reservations coming from each channel on these selected dates.
- Columns: if selected, simplified without channels, it will return the total room revenue alongside the daily operational data for these selected dates “total rooms, occupancy, out of order etc.”
- Choose whether to show the complimentary and house use rooms in the report or no.
- Choose whether you would like to view the confirmed reservations only, tentative reservations only or all.
Report Structure Breakdown
1. Channel Performance Section
For each channel (e.g., Direct, OTA, Corporate): Columns:- Adults: Total adult guests for the channel/day
- Children: Total children for the channel/day
- Room Revenue: Revenue from rooms sold through this channel, excluding packages.
- Revenue: Total revenue (includes packages)
- ADR: Average Daily Rate = Room Revenue / Rooms Sold (for the channel)
- RevPar: Revenue Per Available Room = Room Revenue / Total Rooms Available to sell (not rooms sold)
- Rooms: Number of rooms occupied/sold for this channel
2. Total Channels Section
Sum of all the above columns across all channels for the hotel each day. Columns:- Same as above: Adults, Children, Room Revenue, Revenue, ADR, RevPar, Rooms
3. Room & Occupancy Summary Section
Columns Explained:- Total Rooms: Total physical rooms in the hotel
- Occ. Rooms (Total): Number of rooms occupied, regardless of use
- Rooms Available: Rooms available for sale (not out of order)
- Out of Order: Rooms not available due to maintenance, etc.
- Comp. Rooms: Complimentary rooms (house use, staff, VIP, etc.)
- House Use Rooms: Rooms occupied but not for sale (staff, operations)
- Rooms to Sell (Total): Total rooms that can be sold = Total Rooms - Out of Order
- Paid Rooms: Rooms occupied by paying guests
- Occ. %: Occupancy percentage = (Occ. Rooms (Total) / Rooms to Sell (Total)) × 100
- Occ. % - HU: Occupancy % minus house use = ((Occ. Rooms - House Use) / Rooms to Sell) × 100
- Occ. % - Comp: Occupancy % minus complimentary = ((Occ. Rooms - Comp. Rooms) / Rooms to Sell) × 100
- Occ. % - Comp/HU: Occupancy % minus comp & house use = ((Occ. Rooms - Comp. - House Use) / Rooms to Sell) × 100
- Arr. Rooms: Number of arrivals (rooms) for the day
- Dep. Rooms: Number of departures (rooms) for the day
Key Formulas (How the Numbers Are Calculated)
- ADR (Average Daily Rate) = Room Revenue / Rooms Sold
- RevPar (Revenue per Available Room) = Room Revenue / Total Rooms Available
- Occ. % = (Occupied Rooms / Rooms to Sell) × 100
- Occ. % - HU = ((Occupied Rooms - House Use) / Rooms to Sell) × 100
- Occ. % - Comp = ((Occupied Rooms - Comp. Rooms) / Rooms to Sell) × 100
- Occ. % - Comp/HU = ((Occupied Rooms - Comp. - House Use) / Rooms to Sell) × 100
Example:
Monday, 18/08/2025
- Adults: 212
- Children: 43
- Room Revenue: 137,235.00 EGP
- Revenue (All): 137,235.00 EGP
- ADR: 960.49
- RevPAR: 718.77
- Rooms Sold: 143
Occupancy & Inventory Stats for 18/08/2025
- Total Rooms: 191
- Occupied Rooms (Total): 143
- Rooms Available: 191
- Out of Order: 0
- Comp. Rooms: 0
- House Use Rooms: 0
- Rooms To Sell (Total): 191
- Paid Rooms: 143
- Occ. %: 74.87%
- Occ. % - HU: 74.87%
- Occ. % - Comp: 74.87%
- Occ. % - Comp/HU: 74.87%
- Arr. Rooms: 27
- Dep. Rooms: 27
Example: Tuesday, 19/08/2025
- Adults: 216
- Children: 36
- Room Revenue: 139,630.00 EGP
- Revenue: 139,630.00 EGP
- ADR: 964.13
- RevPAR: 731.00
- Rooms Sold: 145
Occupancy & Inventory Stats for 19/08/2025
- Total Rooms: 191
- Occupied Rooms (Total): 145
- Rooms Available: 191
- Out of Order: 0
- Comp. Rooms: 0
- House Use Rooms: 0
- Rooms To Sell (Total): 191
- Paid Rooms: 145
- Occ. %: 75.92%
- Arr. Rooms: 22
- Dep. Rooms: 21
How to Read the Numbers?
- Room Revenue: Total actual (posted) revenue for rooms for the day.
- ADR (Average Daily Rate):
Room Revenue / Paid Rooms - RevPAR (Revenue per Available Room):
Room Revenue / Rooms Available - Occupancy %:
(Occupied Rooms / Rooms Available) * 100 - Adults / Children: Number of adult and child guests in-house, by reservation channel, and total.
What Affects These Numbers?
- Past dates reflect actual, posted reservations and revenue.
- Future dates reflect projected (predicted) revenue and occupancy based on the reservations’ accommodation breakdown that is driven by the rate plans; nothing is yet posted.
Troubleshooting & Reconciliation
- If ADR or RevPAR appear unusually high/low, verify that “Paid Rooms” or “Rooms Available” is accurate (sometimes housekeeping or maintenance status affects the available room count).
- Discrepancies between “Room Revenue” and what is in your folio/billing system should be checked against individual reservation postings.
- If numbers for “Adults” or “Children” are off, check the reservation breakdowns and if the source data (channel, date, status) matches the actual guest stays.
Example Formula Breakdown (from 18/08/2025)
- ADR: 137,235 EGP / 143 Rooms = 960.49 EGP
- RevPAR: 137,235 EGP / 191 Rooms = 718.77 EGP
- Occupancy %: (143 / 191) × 100 = 74.87%
Update: 13 May, 2026
Multi-Currency Support
The Revenue & Occupancy Statistics Report now supports multi-currency — view revenue, ADR, and RevPar in any configured currency.| Currency parameter added. Revenue, ADR, and RevPar fields now support multi-currency display using live exchange rates, per report version. |
|---|
 Converted Fields by Report Version
When a currency other than the base is selected, the following fields are automatically converted:
Detailed Version:
Converted Fields by Report Version
When a currency other than the base is selected, the following fields are automatically converted:
Detailed Version:
- Revenue (Per Channel & Total Channels)
- Room Revenue (Per Channel & Total Channels)
- ADR (Per Channel & Total Channels)
- RevPar (Per Channel & Total Channels)
- ADR
- RevPar
- Total Hotel Revenue
- Total Room Revenue
- ADR
- RevPar