Visualize 12 Months of Daily Occupancy Trends in One View.Documentation Index
Fetch the complete documentation index at: https://help.kwentra.com/llms.txt
Use this file to discover all available pages before exploring further.
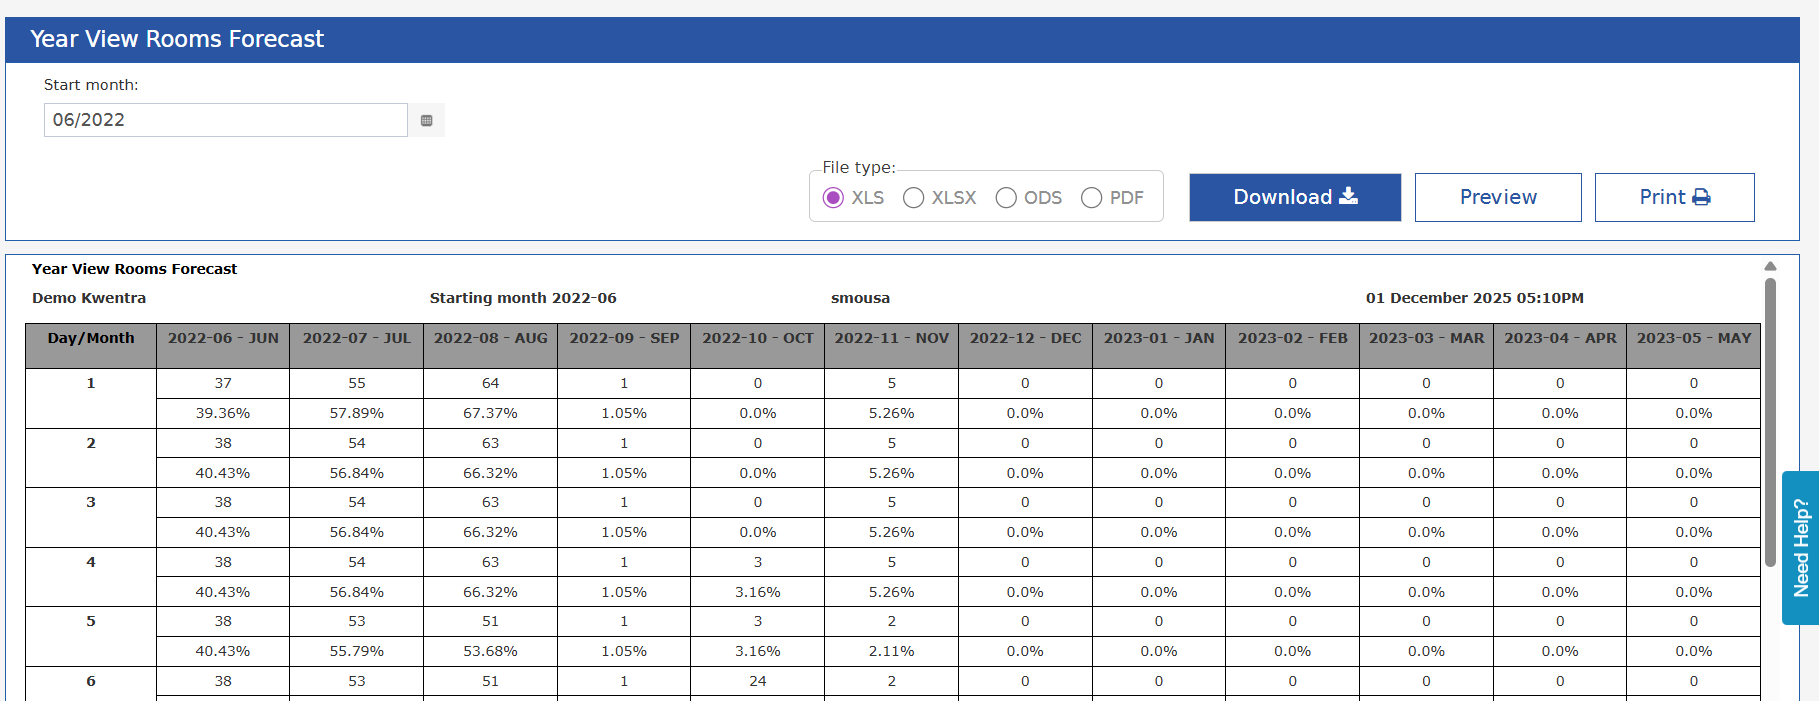
The Year View Rooms Forecast report provides hotel management with a complete 12-month rolling view of daily expected or historical room occupancy. This report helps teams identify occupancy trends, seasonality patterns, and pacing gaps using daily room-level data.
Business Value
- Better Long-Term Planning: Analyze year-ahead occupancy to support forecasting and budgeting.
- Identify Seasonality: Compare daily occupancy trends across a full year.
- Revenue Optimization: Spot compression periods and low-demand months early.
- Single, Consolidated View: No need to generate multiple reports.
How to Access
Reports → FO → Reservation → Year View Rooms ForecastReport Parameters
- Single month picker, determines the starting month for the 12-month rolling view
Report Outcome
Columns
- Date range displayed (12 months from selected month)
Rows (1–31)
- Each row = day of the month
- Shows:
- Occupied Rooms (absolute number)
- Occupancy % (formatted to one decimal place)
For dates that don’t exist (e.g., Feb 30), the cells appear N/A.
Summary Row (Bottom)
For each month:- Total occupied room-nights
- Average occupancy percentage
Daily Data Retrieval
- Query retrieves daily occupancy values for the full 12-month period
- Supports past, current, and future dates
- Works with forecast data and historical room-night data
Update: 6 May, 2026
New Number Of Guests Column and Grand Total Row
The Year View Rooms Forecast Report adds a Pax column, a Year Grand Total row, and a redesigned single-row-per-day layout with three sub-columns per month. Each day of the month is now displayed as a single row with three sub-columns per month The header is two-tiered: the month label (e.g. Apr-26) spans the three sub-columns above, with Rooms | Pax | OCC% as sub-headers beneath each month.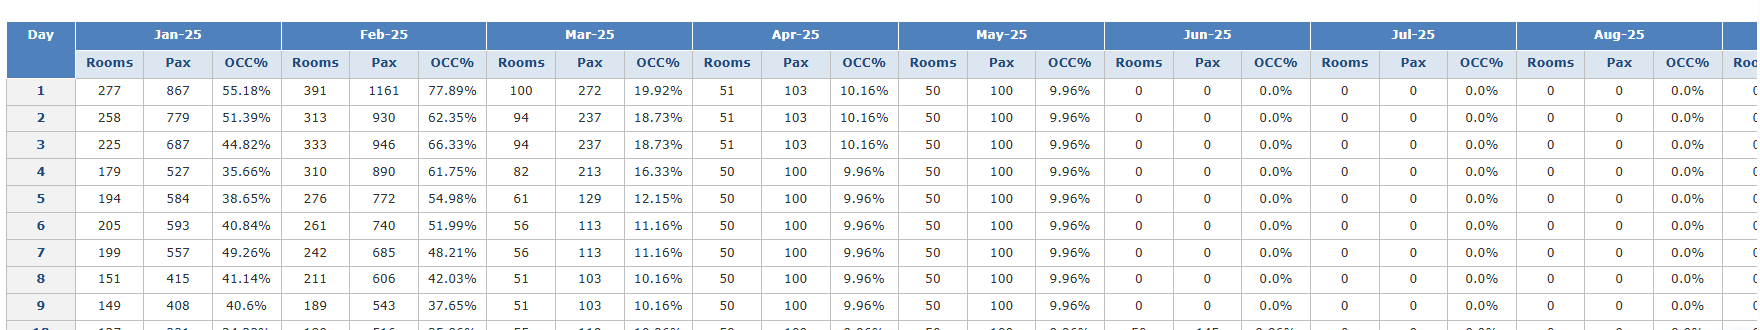 Month Total Row
The existing total row at the bottom of the report continues to show per-month sums of Rooms, Pax, and OCC% across all days of that month. OCC% on this row is calculated on the totals, not an average of daily values.
Year Grand Total Row (New)
A new Year Grand Total row appears below the Month Total row. It shows:
Month Total Row
The existing total row at the bottom of the report continues to show per-month sums of Rooms, Pax, and OCC% across all days of that month. OCC% on this row is calculated on the totals, not an average of daily values.
Year Grand Total Row (New)
A new Year Grand Total row appears below the Month Total row. It shows:
- Rooms — sum of all daily Rooms across the full 12 months
- Pax — sum of all daily Pax across the full 12 months
- OCC% — computed on the totals (total Rooms / total available inventory across the full year)
| The Year Grand Total row is visually distinct (bold/shaded) to distinguish it from the per-month total rows. Days that do not exist (e.g. Feb 30) display N/A and are excluded from totals. |
|---|
