View aggregated revenue and occupancy KPIs across all selected hotels in a single consolidated report.Documentation Index
Fetch the complete documentation index at: https://help.kwentra.com/llms.txt
Use this file to discover all available pages before exploring further.
Business Value
- Eliminates the need to combine individual hotel reports manually.
- Provides a unified, portfolio-level visibility for multi-property operators.
- Enhances executive decision-making with consolidated KPIs.
- Supports financial controllers with accurate multi-property variance analysis.
- Streamlines revenue performance review across all operational hotels.
Use Cases
- Executive Performance Review: CEOs and owners analyze portfolio-wide revenue and occupancy trends.
- Financial Consolidation: Controllers aggregate revenue and budget data across multiple hotels.
- Regional Comparisons: Multi-property GMs compare hotel-to-hotel performance using the detailed version.
- Forecasting & Strategy: Consolidated metrics help determine pricing strategy and operational needs.
- Operational Oversight: Identify underperforming hotels quickly using weighted KPIs.
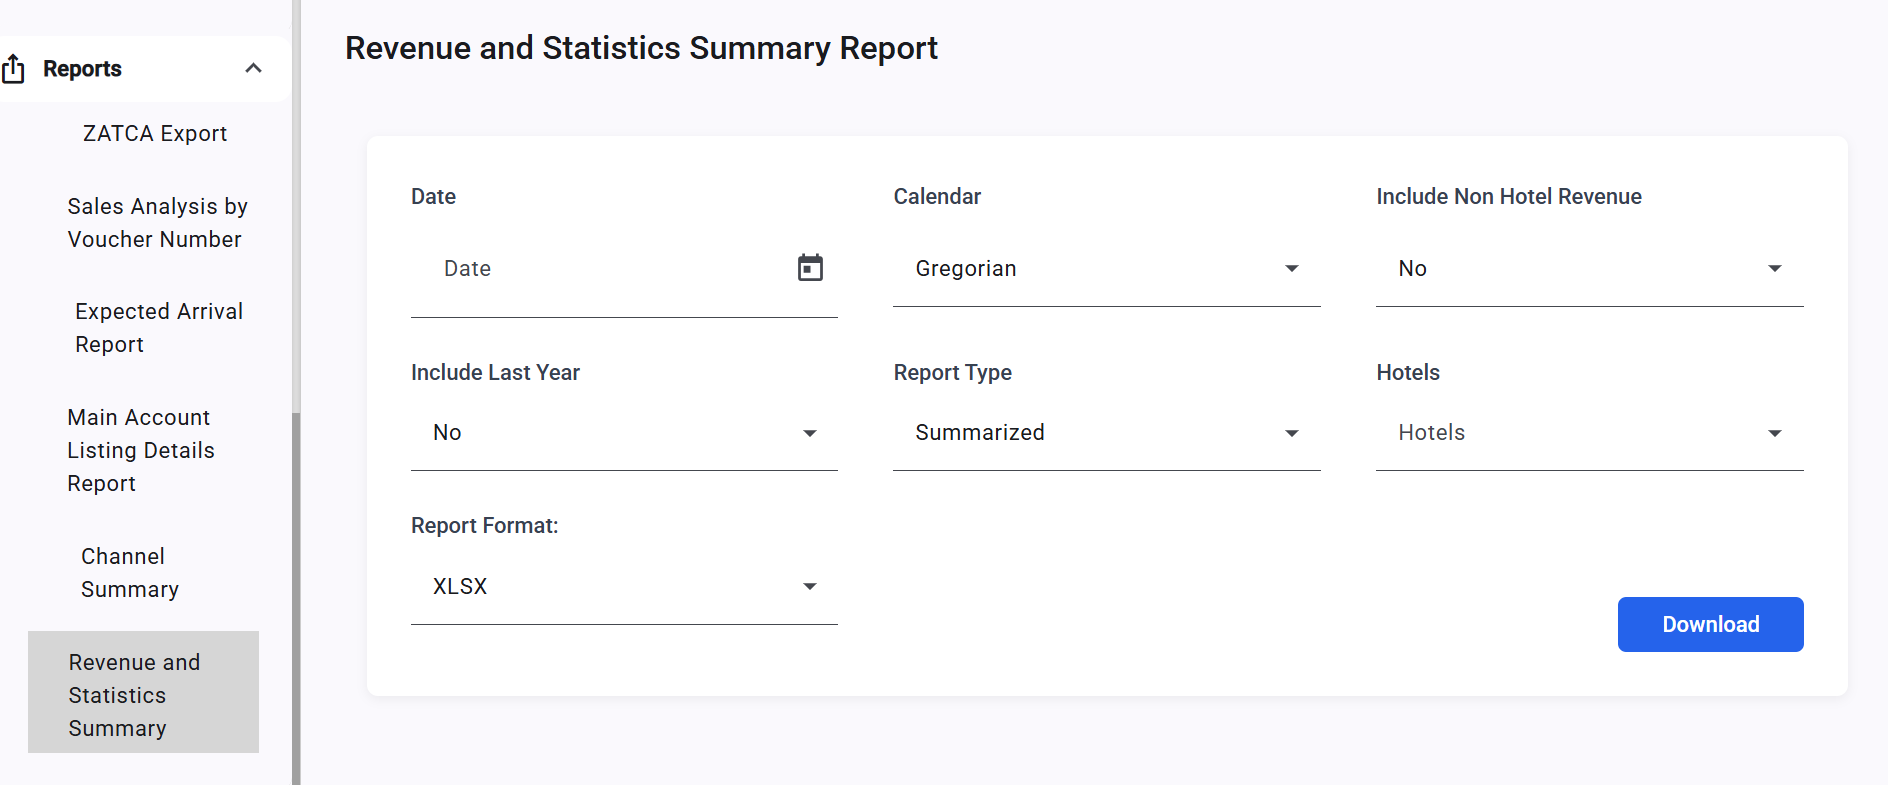
Report Parameters
1. Date Filter (Mandatory)- Single date picker for analysis
- Supports Gregorian and Hijri calendar display
- Gregorian (default)
- Hijri
- Autocomplete list of all company hotels
- Automatically excludes head office and demo/training hotels
- If nothing is selected → all operational hotels are included
- Summarized (default): Consolidated totals only
- Detailed: Totals + individual hotel breakdown under each KPI section
- Checkbox: Exclude Non-Hotel Revenue
Report Outcome Sections
Section 1: Statistics
- Rooms To Sell
- Out Of Order
- Out Of Service
- Cancellation Rooms
- No Show Rooms
- House Use Rooms
- Complimentary Rooms
- Arrival Rooms
- Arrival Guests
- Departure Rooms
- Departure Guests
- Occupied Rooms
- Occupied Rooms (Without Comp. & HU)
- Guest Inhouse
- Guest Inhouse (Without Comp. & HU)
- Occupied %
- Occupancy % (Without Comp. & HU)
Section 2: Total
- Total Hotel Revenue
- Total Hotel Revenue Per Room
- Total Hotel Revenue Per Room (Without Comp. & HU)
- Total Hotel Revenue Per Available Room
- Total Hotel Revenue per Guest In-house
Summarized View (combines all hotels):
Detailed (adds a breakdown per property)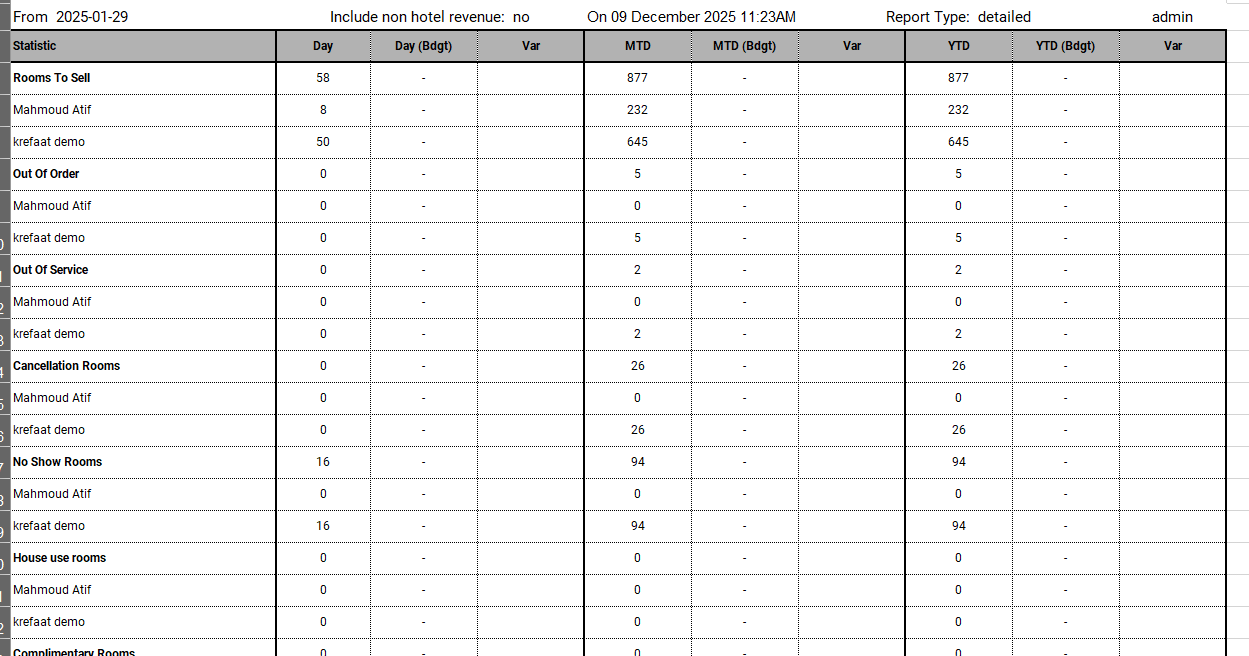
Update: 22 Feb 2026
Hijri Daily Budget Import
Budget figures in the Consolidated Revenue and Statistics Summary Report now reflect Hijri daily imports aggregated from all connected property instances. Budget Calculation Logic — Hijri Daily Budget The report aggregates data from all connected property instances. Budget figures follow the same Hijri daily budget logic applied at each property, then summed at group level. When only a monthly budget is imported:- Day = monthly budget ÷ number of days in the month (per property, then aggregated)
- Month = total monthly budget (aggregated across all properties)
- Year = cumulative sum from start of year (aggregated across all properties)
- Day = imported daily budget for that specific day (aggregated across all properties)
- Month = sum of all imported daily budgets for that month (aggregated)
- Year = cumulative sum from start of year using Hijri daily budgets (aggregated)