Documentation Index
Fetch the complete documentation index at: https://help.kwentra.com/llms.txt
Use this file to discover all available pages before exploring further.
Track, analyze, and export store usage for any date range, grouped and detailed by your operational needs.
Report Business Value:
- Provides a transparent breakdown of how inventory is consumed across departments and stores.
- Facilitates tighter cost control by highlighting major consumption areas and unusual variances.
- Enables data-driven purchasing, budgeting, and inventory decisions with flexible filtering and grouping.
- Supports both summary and detailed analysis, ideal for operational reviews and audit trails.
- Exportable in multiple formats for further analysis or regulatory compliance.
Use Case:
- Monthly review of stock consumption per department (e.g., F&B, HK, Engineering)
- Identifying high-usage items or unexpected consumption spikes
- Cross-checking store issues versus expense accounts for audit
- Preparing cost allocation reports for department heads
- Exporting detailed usage records for regulatory submission
How it works?
Reports → BO → Inventory → Stock Usage- From date / To date: Pick the reporting period (e.g., 2025-10-01 to 2025-10-31).
- Group by: Choose how to group the data (From Store, Expense Account, Item Group, Usage Department).
- Detail: Choose report level (Summary, Itemized, Detailed).
- State: Filter by state (Submitted / Pending).
- From Store, Expense Account, Usage Department: Filter for specific stores, accounts, or departments.
- Item family, category, group: Further refine your item selection.
- Show zero values: Decide whether to show items with zero usage.
- Export Options:
- Select file type (XLS, XLSX, ODS, PDF), then click Download to export, Preview to view, or Print for a hard copy.
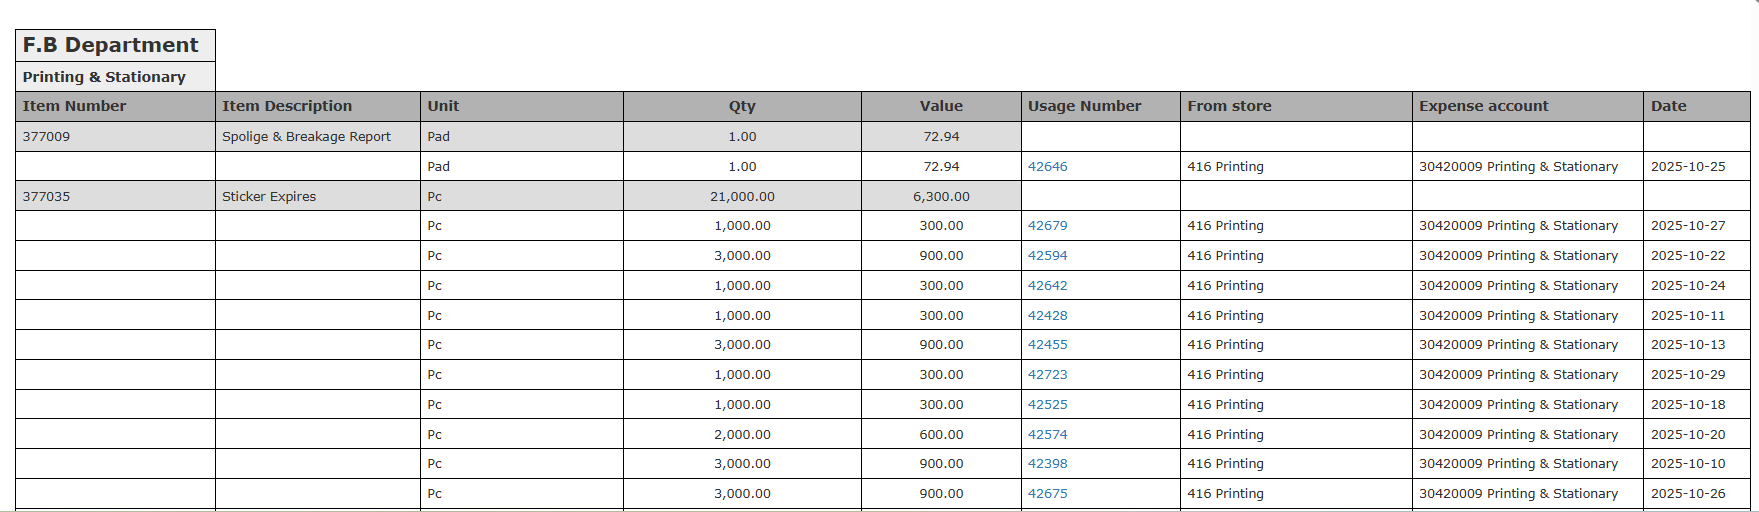
 In the Detailed view, it lists every item usage, including: Item Number, Description, Unit, Quantity, Value, Usage Number, From Store, Expense Account, and Date.
Update: 29th of October, 2025
Store Usage Report Enhancement: Group by Expense Account within Usage Department
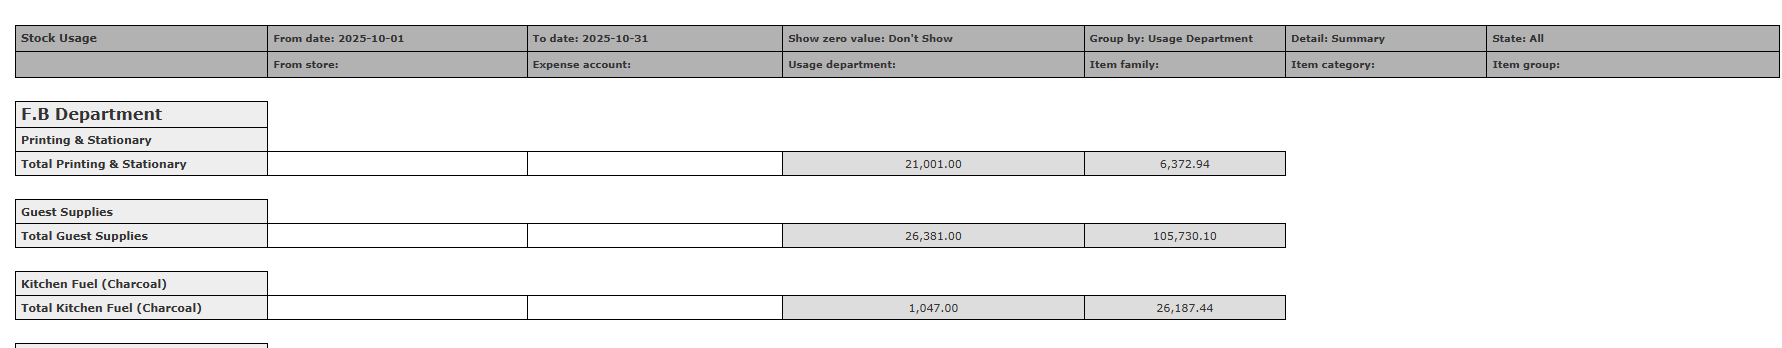
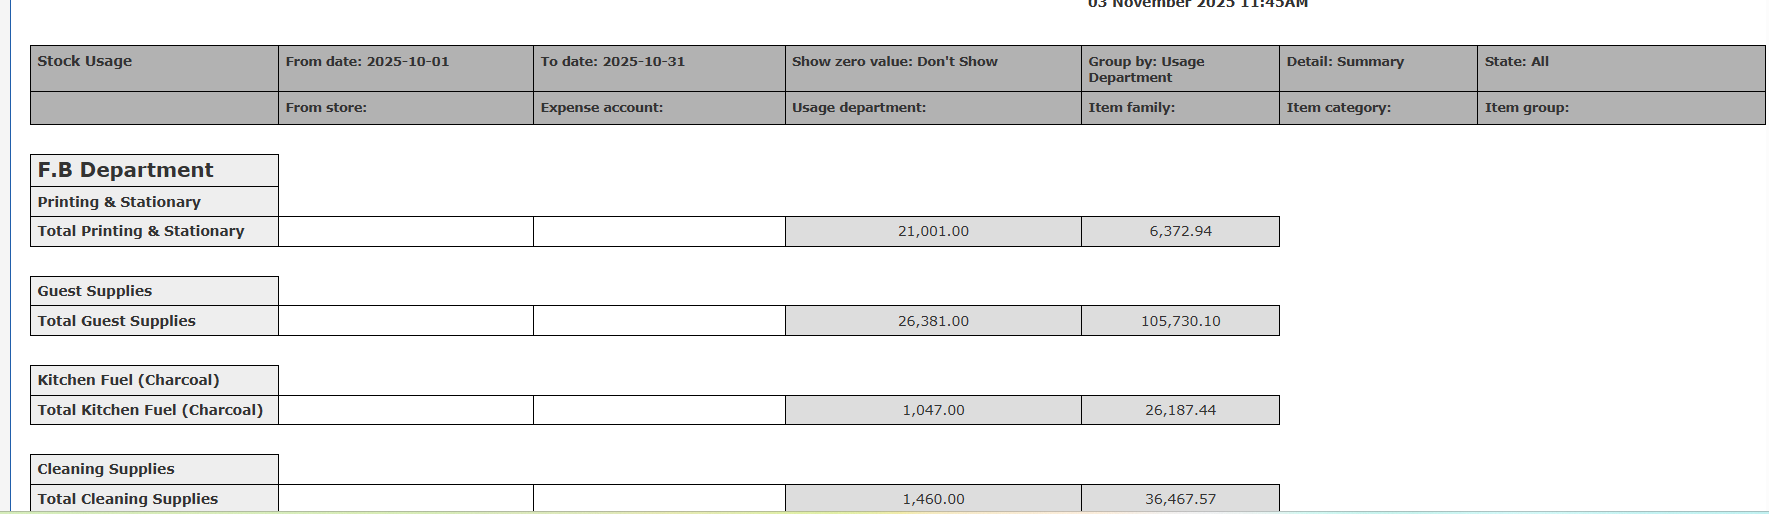
Quickly see your stock usage totals by both department and expense account in the summary report.Use Cases
- A Cost Controller wants to see how much Housekeeping spent on Guest Supplies versus Cleaning Supplies in a glance.
- The finance team needs to prepare department-level budgets and verify how expenses are distributed per account.
- Department heads review their own consumption and cost split by account.
How does it work?
- Group by “Usage Department” as usual.
- The report now displays, for each usage department:
- A total per department (with the department name).
- A breakdown by expense account within the department, with totals for each expense account.
- The Usage Department header is now in a larger font than the expense account headers for clarity.
- “Total” label now reads “Total Usage Department” (e.g., “Total Housekeeping Department”) instead of just “Total”.